
Dashboards & Reporting System
Reporting dashboards that give leadership a clear, trustworthy view of sales, marketing, and business performance.
When leadership cannot clearly see what is happening across leads, sales, campaigns, and operations, decisions are made using incomplete information and gut feel. We build reporting dashboards supported by reliable data, defined metrics, consistent reporting rules, and automation that reduces recurring manual work. The result is a business reporting system your team can trust and use.
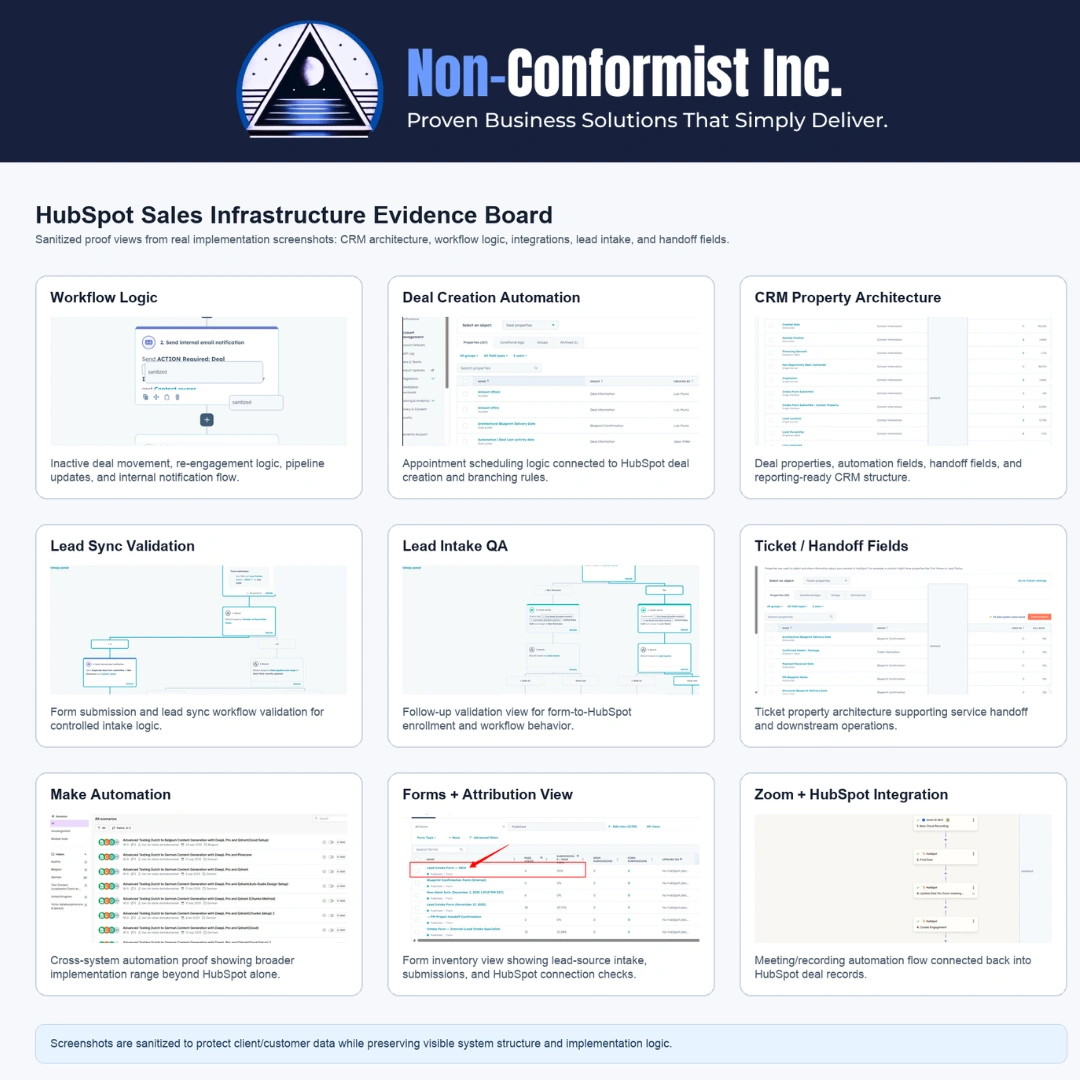
Start Here When Leadership Cannot Trust the Numbers
The problem is rarely just the dashboard software. Reporting becomes unreliable when the data, definitions, sources, ownership, and process underneath it are inconsistent.
Leadership does not fully trust the current reports.
CRM dashboards do not match what the sales team says is happening.
Different platforms report different results for the same metric.
Pipeline reports contain missing, duplicated, or outdated information.
Monthly reporting requires a manual scramble across several spreadsheets.
No one agrees on how important metrics should be calculated.
Lead-source information is incomplete or inconsistent.
Sales activity cannot be connected clearly to pipeline movement.
Campaign results are disconnected from CRM opportunities or revenue.
Operational information is spread across several tools.
Reports contain data but do not show what requires attention.
Teams repeatedly prepare the same reports by hand.
Leadership cannot compare performance consistently over time.
Important decisions are being made without one reliable source of truth.
Apply for the Dashboards & Reporting System
Tell us which numbers leadership and your teams need to see, where the underlying data currently lives, and why the existing reporting cannot be trusted. We review every request to determine whether the project requires data cleanup, metric definition, CRM reporting, connected dashboards, recurring reporting automation, or a combination of these systems.
This is a focused reporting-system build starting at $5,000+. When reporting and visibility are the clear problems, apply for the build. When the underlying issue may involve your CRM, lead process, website, or operations, start with an assessment instead.
Reporting Dashboards Built on Numbers That Reflect Reality
We build executive, sales, CRM, campaign, and operations dashboards around the decisions your company actually needs to make. Before creating charts, we define the data sources, metric definitions, reporting periods, ownership rules, and calculation logic required to make the information dependable.
Where the data foundation is incomplete, we identify and correct the structures that make reporting inaccurate. We do not create attractive dashboards on top of unreliable data. We establish the reporting foundation first and then make the information visible.
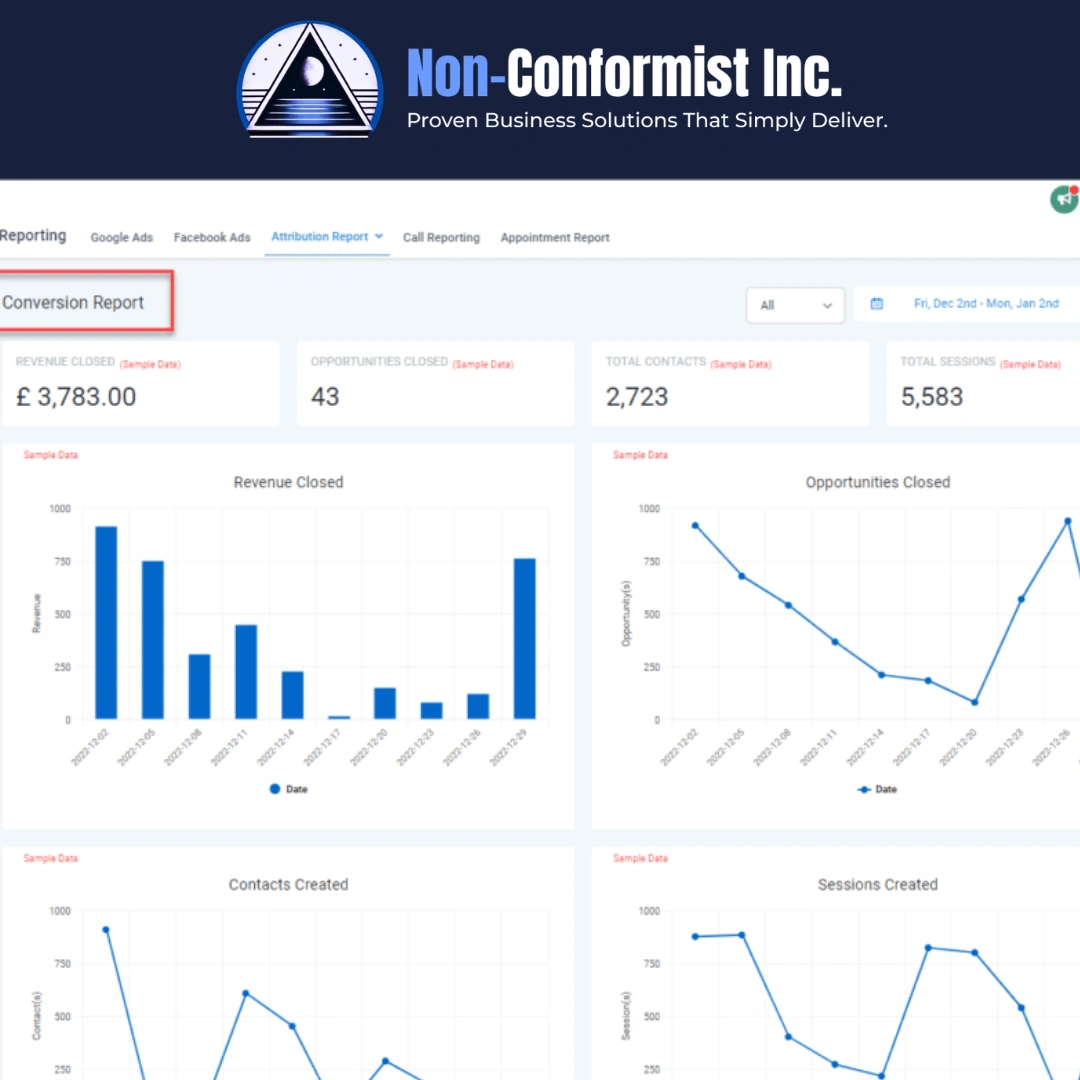
What the Dashboards & Reporting System Is Designed to Create
The system creates a consistent, actionable view of business performance for leadership and the teams responsible for improving it.
Clear executive snapshots.
Trustworthy CRM dashboards.
Sales pipeline and activity reporting.
Lead-source performance reporting.
Campaign visibility.
Operations dashboards.
Consistent metric definitions.
Role-specific reporting views.
Automated recurring reports.
Historical performance comparisons.
Clear ownership of reporting inputs.
One reporting structure across connected tools.
The goal is not to create more charts. The goal is reporting that helps people identify risks, understand performance, and decide what should happen next.
Business Reporting Dashboards Built for Decisions, Not Decoration
Clean the Data. Define the Metrics. Build the Dashboards.
A structured implementation process that moves from unreliable numbers to a business reporting system leadership can use confidently.
What You Get From Trustworthy Reporting Dashboards
A clear view of business performance.
Executive information without manual report preparation.
CRM dashboards that match the underlying records.
Pipeline health visible by stage, owner, and period.
Better visibility into lead sources and sales outcomes.
Sales activity connected to opportunity movement.
Campaign reporting connected to meaningful business results.
Operations dashboards that reveal bottlenecks and exceptions.
Consistent metric definitions across teams.
Faster, fact-based decisions.
Less time spent assembling recurring reports.
Historical views that reveal trends.
Role-based information without unnecessary clutter.
One reporting structure instead of conflicting versions of the truth.
What Reporting Dashboards Look Like in Practice
Representative examples showing how CRM, sales, campaign, and operations data can be organized into clear and actionable reporting views.
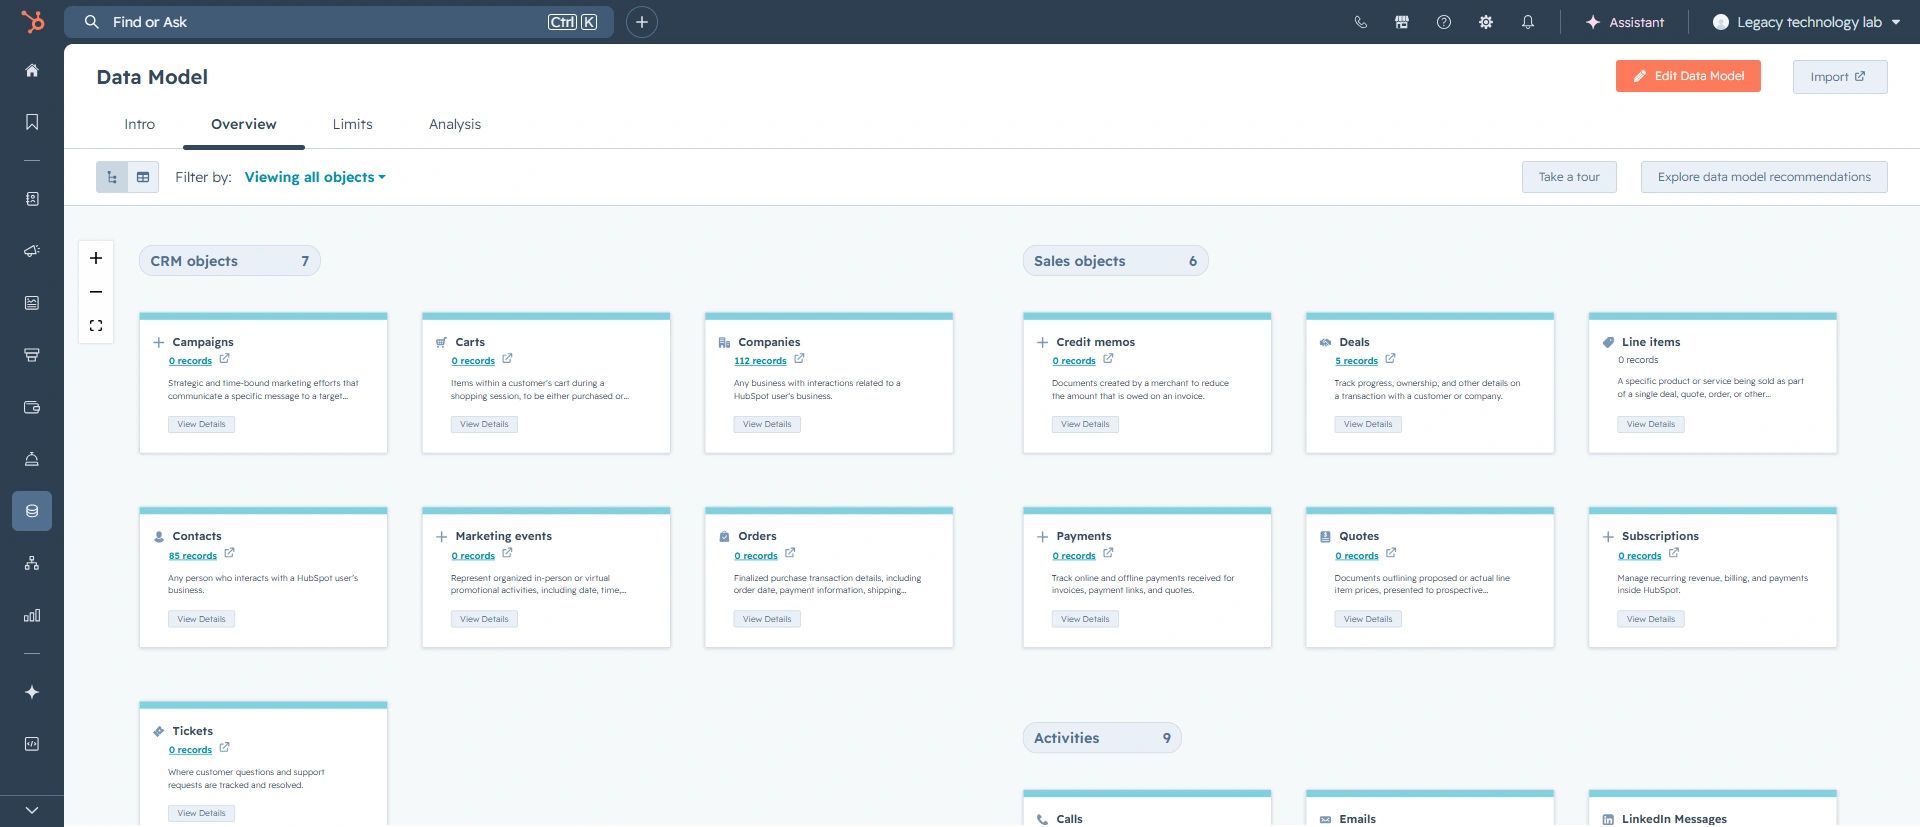
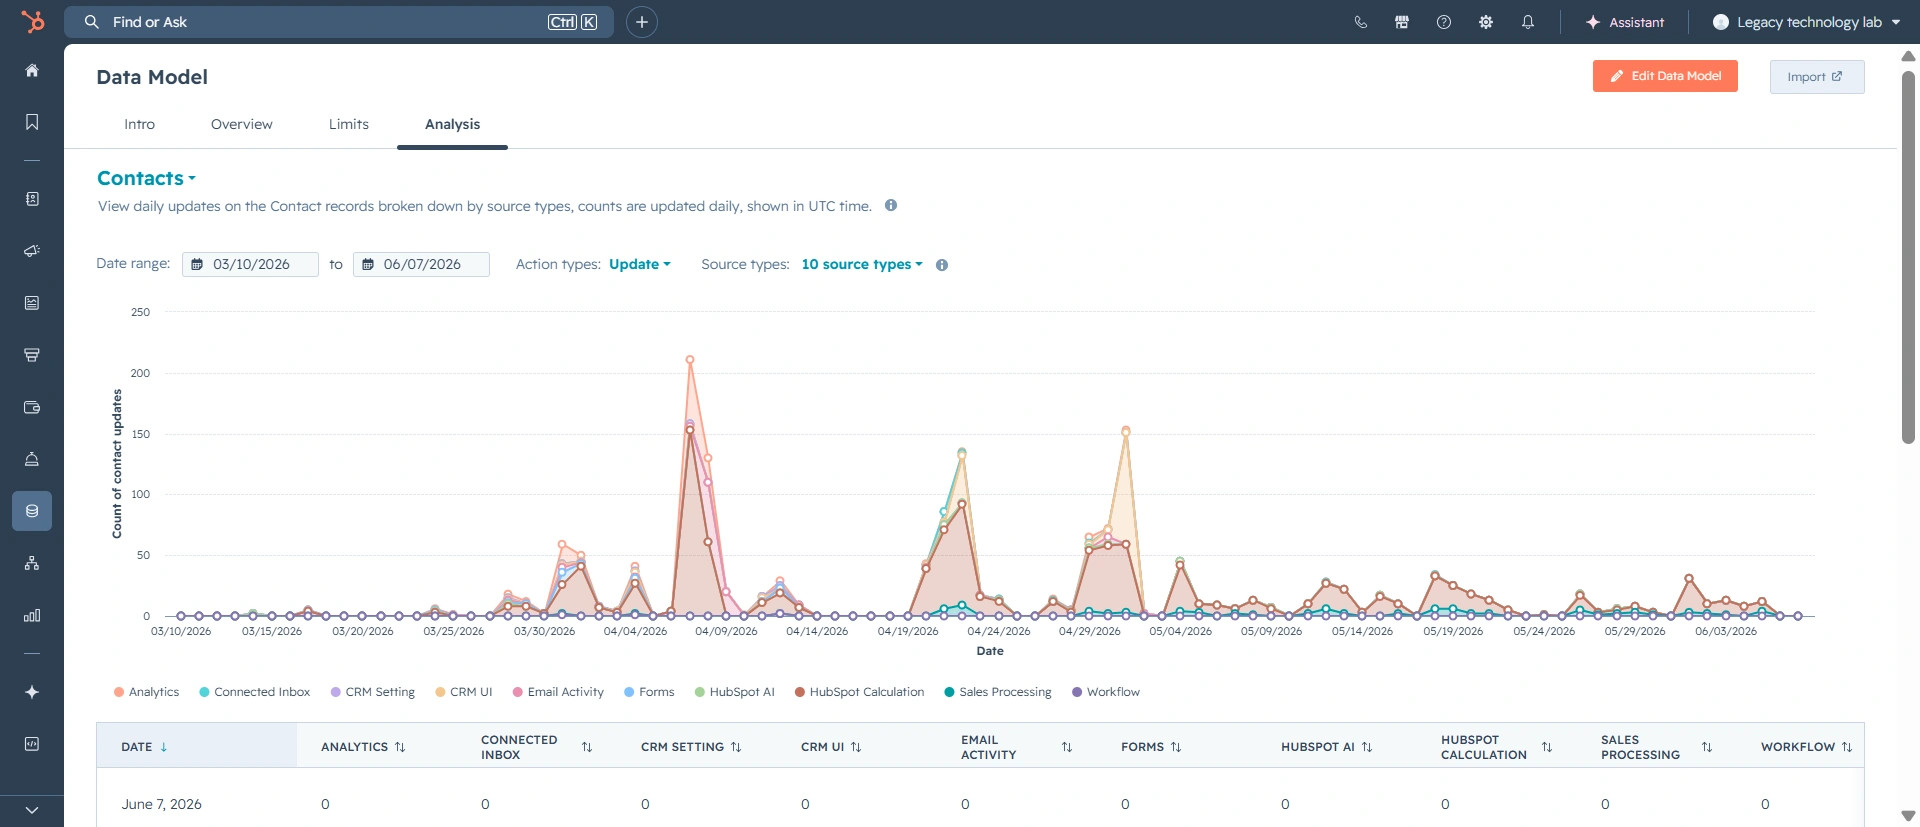
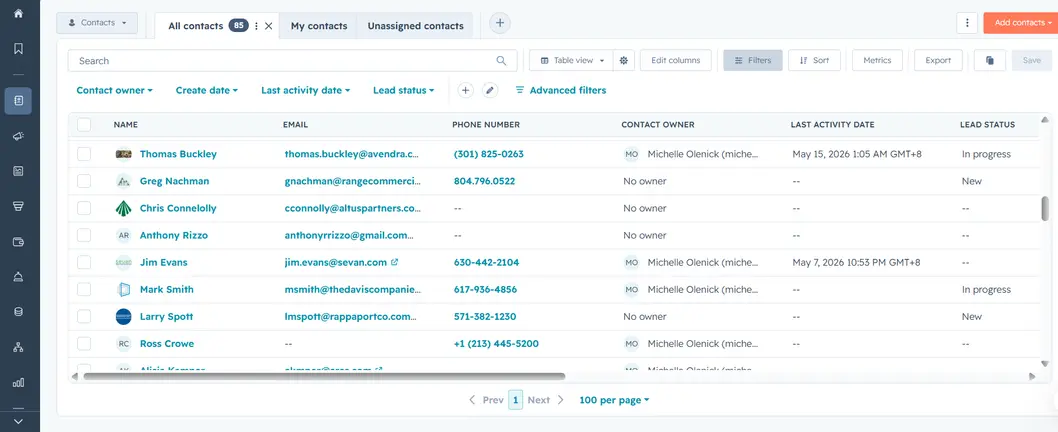
Examples shown are representative of the reporting structures we build. Client data is used only with permission and is blurred or anonymized when required.
Built for Leaders Who Need a Trustworthy View of the Business
The Dashboards & Reporting System is designed for established companies whose data exists but is difficult to interpret, slow to assemble, or unreliable. It is especially useful for owners, leadership teams, sales organizations using HubSpot or GoHighLevel, operations-heavy companies, multi-team businesses, and organizations relying on manual spreadsheets or conflicting reports. When the CRM data structure is unreliable, the CRM Command Center Build may need to come first.
A Serious Reporting Build for Leaders Who Need Reliable Numbers
The Dashboards & Reporting System is a focused implementation for companies that need trustworthy, actionable reporting across sales, marketing, campaigns, CRM activity, and operations.
This is not a single chart, a generic dashboard template, or a basic spreadsheet-reporting task.
Builds typically start at $5,000+. The final investment depends on the number of data sources, condition of the underlying data, number of dashboards, metric complexity, CRM configuration, cross-platform connections, historical reporting requirements, automation, access controls, documentation, and validation requirements. Cross-tool reporting, multi-department views, advanced data modeling, and business-intelligence integrations may require a larger scope.
Which path is right for you?
If reporting is clearly where visibility breaks down, apply for the build. If the underlying problem may involve the CRM, lead process, website, or operations, start with a paid assessment.
Reporting Is Only as Reliable as the Systems Feeding It
The Dashboards & Reporting System can connect information from your CRM, lead-capture workflows, website, campaigns, sales activities, operational tools, and other approved business systems. Reliable connections help ensure reporting begins with consistent information and returns actionable insight to the correct leaders and teams.
CRM data and pipeline structure CRM Command Center Build →
Lead routing and follow-up data Lead Capture & Follow-Up System →
Website conversion and source tracking Website-to-Revenue System →
AI-supported reporting workflows AI Workflow & Agent Build →
Operational data and process reporting Operations Workflow System →
System-wide diagnosis and priorities Business Systems Assessment →
What May Require a Separate System Build
Some projects connect with reporting but require a separate implementation scope. Separating these projects keeps the reporting build focused, testable, and accountable.
Full CRM rebuilds or migrations CRM Command Center Build →
Advanced lead-capture and follow-up systems Lead Capture & Follow-Up System →
Website or funnel rebuilds Website-to-Revenue System →
AI workflow and agent builds AI Workflow & Agent Build →
Sales-asset creation Authority & Sales Asset System →
Complex operations automation Operations Workflow System →
Major data migrations
Data warehouse implementation
Advanced business-intelligence infrastructure
Custom application development
Ongoing campaign management
Large financial-modeling projects
Enterprise data-governance programs
This keeps the reporting build focused while preserving a clear path to expand the system later.
This Is Probably Not the Right Fit If…
We'd rather be upfront. This likely isn't for you if any of these are true:
- You only need one basic chart.
- You are looking for the cheapest dashboard template.
- You do not want to define the decisions the reports should support.
- You are unwilling to correct the underlying data.
- You want dashboards without agreeing on metric definitions.
- You have no process for reviewing or acting on reports.
- You expect attractive charts to repair an unclear sales or operational process.
- You cannot provide access to the required data sources.
- You expect unrelated tools to match without integration or data mapping.
- You are unwilling to maintain required CRM fields and reporting inputs.
- You are not ready to invest seriously in reliable business visibility.
Dashboards & Reporting
Questions
Reporting dashboards organize selected business metrics into clear visual views so leaders and teams can understand performance, identify changes, monitor risks, and decide what requires action.
Depending on scope, we build executive, CRM, sales, lead-source, campaign, operations, pipeline, and recurring business dashboards.
It defines how information is collected, structured, calculated, displayed, reviewed, and maintained. Dashboards are one part; reliable data, metric definitions, reporting rules, and ownership are equally important.
Yes. We can build native or connected CRM dashboards for HubSpot and GoHighLevel, depending on the reporting requirements and available data.
Yes. Sales dashboards may include pipeline value, deals by stage, owner performance, activity, conversion rates, deal age, forecasts, and won or lost outcomes.
Yes, when source information is recorded consistently. Reporting can compare inquiry volume, qualification, opportunity creation, pipeline contribution, and available sales outcomes.
Yes, when the platforms provide suitable integration, export, database, or API access. Cross-platform requirements are reviewed during scoping.
Common causes include missing fields, inconsistent stages, duplicate records, disconnected systems, incorrect filters, unclear metric definitions, and manual reporting errors.
Possibly. When inaccurate CRM data is the primary issue, cleanup may be included in this scope or completed through the CRM Command Center Build.
Yes. Reporting automation can prepare, update, distribute, or notify the appropriate team members when recurring reports are ready.
They can when the required systems, integrations, refresh schedules, and data structures support it. Update frequency depends on the tools and approved scope.
Yes. Leadership, sales, marketing, operations, and other teams can receive role-specific views based on their responsibilities and decisions.
Yes. We document the reporting structure, metric definitions, data sources, dashboard purpose, and important maintenance requirements.
The timeline depends on data sources, data quality, metric complexity, integrations, dashboard count, validation requirements, and reporting automation.
Dashboards & Reporting System builds typically start at $5,000+. Final pricing depends on data, integration, reporting, automation, and validation requirements.
Not when reporting is clearly the primary problem. Start with the assessment when unreliable reporting may be caused by broader CRM, lead-process, website, sales, or operations issues.
Make the Numbers Tell the Truth
Your company already has information. The problem is turning it into reporting people can trust and use. We build reporting dashboards that connect the right data, apply clear metric definitions, reduce manual reporting, and give leadership a dependable view of the business.